logo
Browse gene list

CG id: ArrayCG17531
Affymetrix gene: GstE7
Affymetrix probe id: 1640065_at


Gene expression levels

phase mitosis meiosis post-meiosis
value 1 6.50 5.90 8.37
value 2 6.61 6.06 8.07
value 3 6.49 6.01 8.11
average 6.53 5.99 8.18
Values 1-3 correspond to the expression intensity (log transformed) obtained from Microarray hybridization of three different biological replicates of each spermatogenic phase. Averages values correspond to the arithmetic average within replicates for each spermatogenic phase.
plot image

Comparison of expression levels

phase mitosis meiosis post-meiosis
mitosis - Over Under
meiosis - - Under
post-meiosis - - -
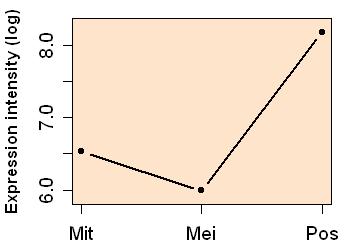
The classifications in this table (Equal, Over or Under) were obtained by our Bayesian Statistical Model (Methods). Each classification is given to a pair-wise comparison between two spermatogenic phases. For example, "Over" mitotic vs. meiotic classification means that, for this gene, the mitotic expression is significantly higher than the meiotic expression.